
Introduction to Data Analysis and Visual Design with Tableau
Intro
Back in 2017, I was invited to give a talk at Product School at their San Francisco office about data analysis and visualization in Tableau. Since then I have given a variation of this talk at their other location in Santa Clara and was invited to give the talk at San Jose State University to a class of Business School students.
If you would like to watch the talk, you can either watch in on Facebook here or watch it below. If you would like to review the slides, with the animated instructional GIFs, I’ve attached them below as well. The two dashboard views can be found on my public tableau page here.
Process
- Data Collection
- Dashboard Creation
- Slide Deck with Instructional GIFs
- Presentations
1. Data Collection
I initially set out to use previous work projects as examples but instead opted to collect my own data to make this project more personal. Since I embedded detailed GIFs into my deck, I did not want to use any proprietary data. I chose to track the places that I visited and length of each visit for an entire month.
I tracked how much time I spent: working, eating out, exercising, doing chores, cooking, etc. One of my personal goals was to learn something new about myself and potentially change some of my hehavior based on what patterns I saw. I actually did end up changing 2 things after visualizing my data.
2. Dashboard Creation
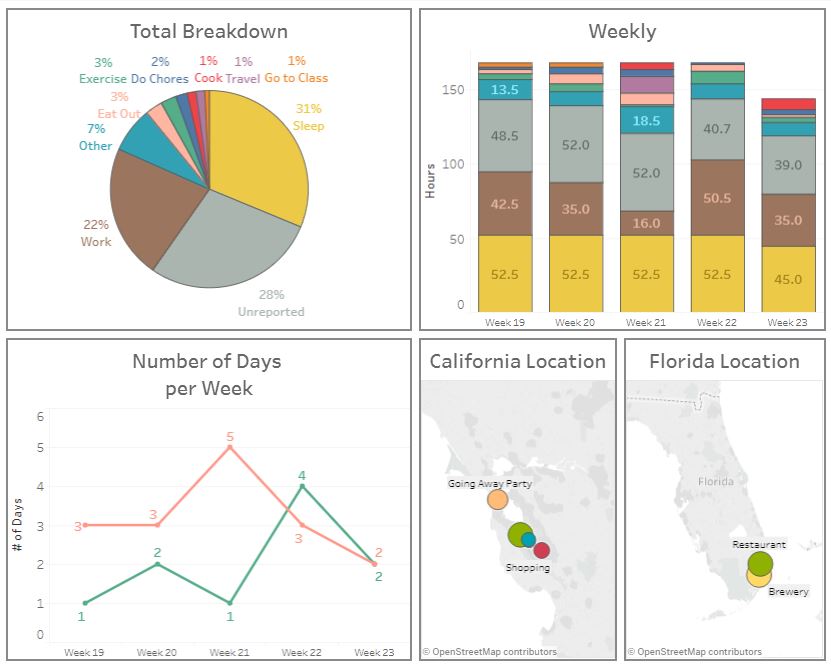
I created two interactive dashboards to explain the thought process behind data design as well as to show the breadth of visualizations available in Tableau. The first one was a general overview of my month, which is typical of the types of high level dashboards companies use to summarize data. These type of views are used to monitor as well as identify any big changes, which would then require further investigation.
For instance, week 21 jumps out at me immediately as there is a dip in the brown category in the upper right chart. There is also something interesting going on in the bottom left chart with the green spike.
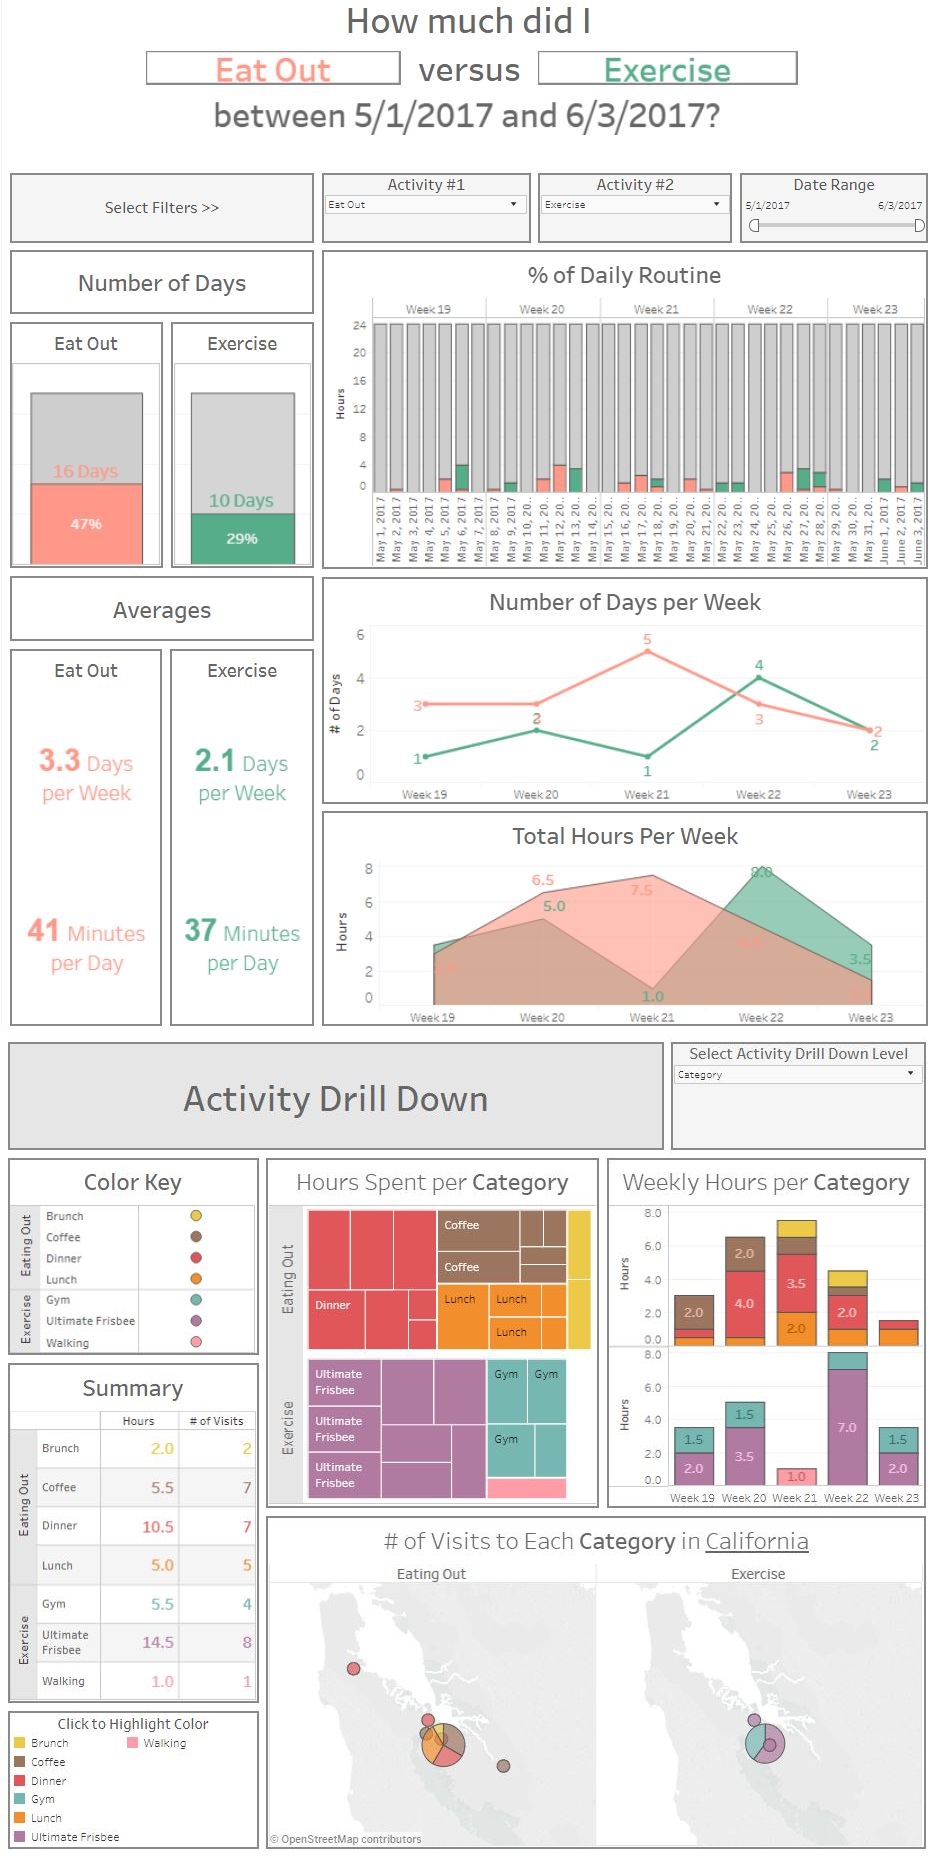
The second one was a deep dive into my activities. This is the dashboard I would use to understand the trends and patterns on a more micro level. I could select a different activity and investigate the dip in work that occured on week 21. I could also examine the current chart to see what happened to that green spike (hint this is when I started creating my report and realized I wasn’t working out much, hence I immediately went to the gym).
3. Slide Deck with Instructional GIFs
Other than having a fun data source to work with and something that everyone could relate to, I wanted to put together a presentation that others could refer back to if they got stuck on something. I decided that GIFs would be a good way to help walk people through the steps needed to complete a chart from start to finish.
4. Presentations
In the above recorded 20 minute talk, I presented some general tips for creating data reports as well as how to build indepth and dynamic dashboards in Tableau. The second part of the talk went into detail about how to build various types of visualizations, where I went over 5-25 second instructional GIFs that I created. I made this second part as modular as possible so that it would be easy to refer back to later if there were any specific questions about creating the charts. Each of my talks also had a 15 minute Q&A session where I answered more general questions (the first one is recorded above).
Concluding Thoughts
I really enjoyed giving this presentation and hope that those who attended my sessions were able to take something away from my talks.
I also learned one or two things about myself from the data that I collected. I realized that I wasn’t exercising as much as I’d like and so I immediately started to work out more (you can see the green spike in the chart above). Also seeing where I ate out and that it was only within a 2 mile radius of my house made me re-evaluate my decisions.
Leave a Comment