
How has my life changed since shelter-in-place (in charts)?
I am no stranger to a Netflix season binge accompanied by some takeout and perhaps a bottle of wine. Youtube and I were also quite well acquainted before the shelter-in-place went into effect. I am familiar with the illusion of the short 5 minute video and how easily it turns into just 5 more minutes and before you know it, it’s been 45 minutes.
So how exactly has my life changed?
Exercise, or the lack thereof
Too bad watching someone exercise on Youtube doesn’t count. Walking from the couch to the kitchen back to the couch, then to my desk just doesn’t add up to that many steps (it’s less than 2k steps, but who’s counting).
I realized that I am a destination walker, I need purpose other than the walk itself. I used to walk to work when I got off the Caltrain in SF, not because I wanted exercise, but primarily because they moved the bus stop one street in the opposite direction of my office. I walked further to avoid paying extra parking fees. I’d walk to the field where pickup ultimate was, and if it was possible to park any closer to the field, I would have.
Nowadays if I get more than 6K steps, that’s a good day (though that was also a good day before, it was just less effort). Maybe I should consider adopting a dog, that is if there are any left in shelters. I have now walked around my neighborhood more in the last 2 months than I have in the 4 years that I lived here (who knew there was such a nice residential area several blocks over and even a couple of “hidden” parks).
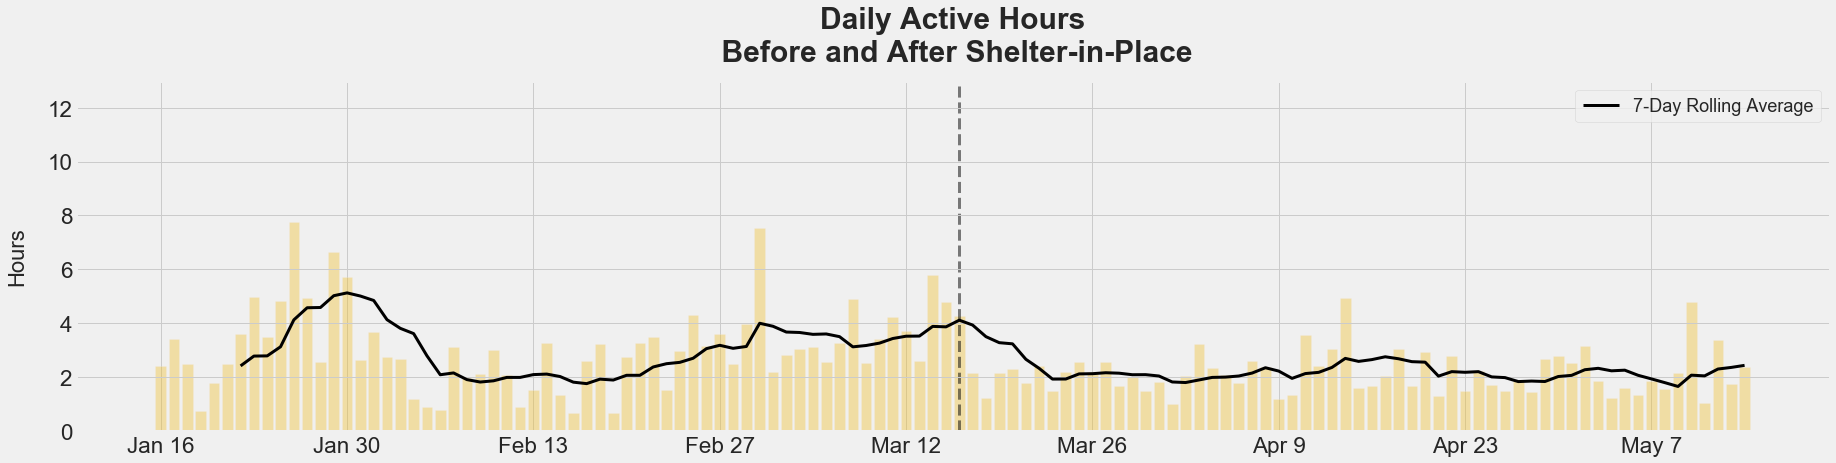
So how does my activity level compare to before? If I just look at time spent moving, I spent an average of 3 hours doing some sort of physical activity before, whether it was walking over to the kitchen in the office or snowboarding on the weekend. I am currently spending 2 hours moving, on average (you can only go on so many walks, imo).
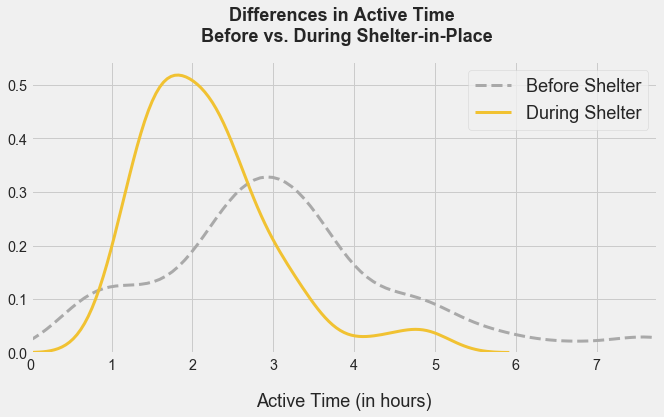
Just eyeballing the chart below, the two density plots don’t look all that different, right? At this point, that’s wishful thinking. Sadly, technically speaking, they actually are quite different (running a Welch’s t-test on the data shows that there is actually a significant difference in average time spent moving). This does not come at that much of a surprise.
What is interesting, though not really surprising if I think about it more, is how much variability I had before. I definitely had a handful of days where I got fewer steps in than I do now, but I would “make up for it” on the weekend (that’s how exercise works, right). Ultimately, those “make up” days, at least time wise (not accounting for intensity), did result in moving the average up. I had enough of those days to offset the low activity days.
Since I have gotten a bit tired of walking, I’ve recently started to add a bit more variety to my activities (and intensity to my occasional workouts), I have started cycling and, having watched enough Youtube videos, actually feel confident enough to give some of them a try (my recommendations Chris Heria, Natacha Oceane, MadFit and MrandMrsMuscle ). I am curious to see the variations of difficulty of my workouts, which I will take a closer look at in a future post.
Hopefully some of these newer habits stick around after we return to some level of normalcy, but who knows, this might be the new normal for a while.
So if I am spending less time moving, what am I spending more time on?
My laptop and smartphone are my new best friends
Let’s be real, they aren’t new friends, we are just getting acquainted on a whole new level.
My previous device usage was like a pendulum; I would have stretches of time that I would spend long hours on the computer and periods where I would achieve a better balance. Now, most days are the same, with an occasional day here and there where I manage to spend fewer than 4 hours staring at a screen.
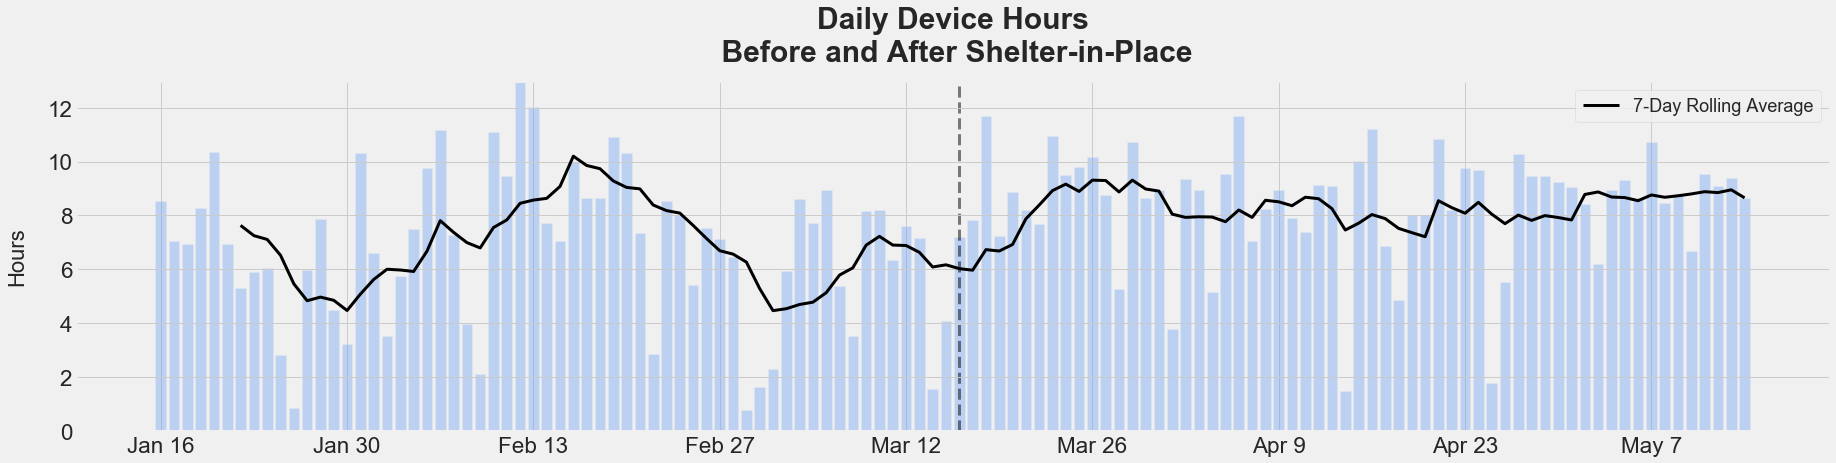
I am surprised that I previously had several days where I spent even more time on the computer then I did during shelter-in-place. I was even more surprised that the number of days which exceeded 10 hours only differed by two days, with 10 days exceeding 10 hours of screen time during shelter-in-place.
I’ve definitely spent a lot of time obsessing over the news, whether it was following along what was happening in Wuhan on Twitter back in January when it all first started or the hourly updates as the shelters started to take place to now as parts of the country start to re-open.
Youtube, HBO and Netflix have been my escape. I watched so much stand up comedy (I feel like I owe a special thank you to the following comedians: Sam Morril, Mae Martin, Josh Johnson, Emily Heller, Jim Gaffigan, Taylor Tomlinson, Rachel Mac), finished a handful of shows (Westworld, Unorthodox, Feel Good to name a few) and started watching youtube videos of tiny homes (I find them theraputic and love seeing how different people design essentially the same tiny space).
I have been able to complete an online course in this time (here’s my final project: A statistical flow chart) and wrap up the first phase of a semi-automated self tracking project used to generate the charts for this post.
Since my day job entails a lot of computer time, I picked up an old textbook, old being a relative term, on TensorFlow just so I can get a break from my screen.
I’d say I have been both productive and uproductive, in a way, my old pendulum self, just within the realm of a device. Whereas before I was spending 67% of my awake time on a device, I am now up to 78% (yikes, that’s a lot!).
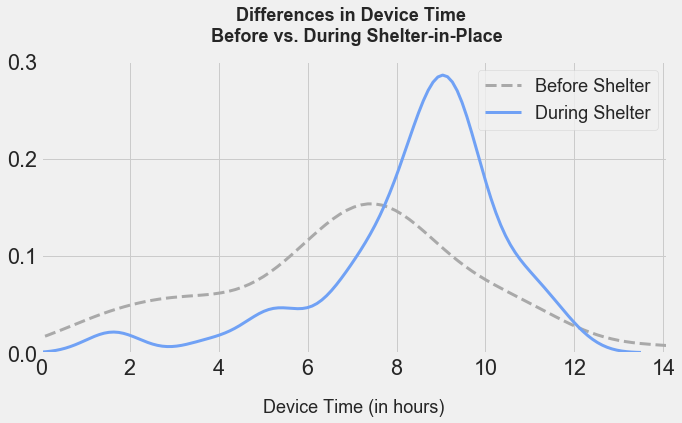
This chart, just like the first chart on exercerise, just emphasizes how little variety there was day-to-day. And if we run a formal Welch’s t-test on the data (I am certain that is where your mind went after seeing those Gaussian distributions), I am, statistically speaking, spending on average more time staring at a screen now than I was prior to the shelter-in-place.
Surely I am sleeping more…
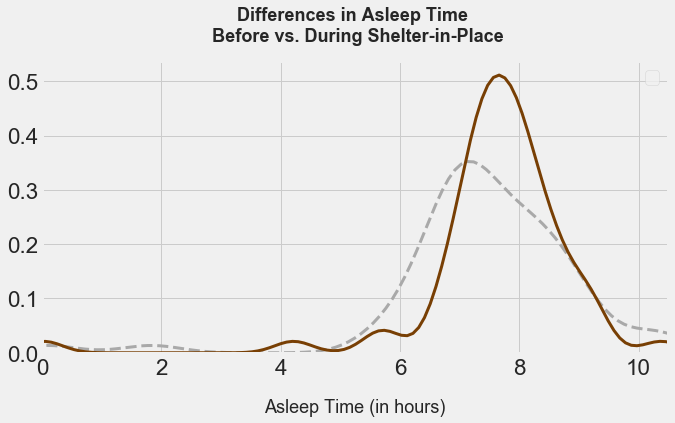
The sad reality is that despite being within a 5 second walk of my bed at almost any given moment, I am not sleeping any more than I was before.
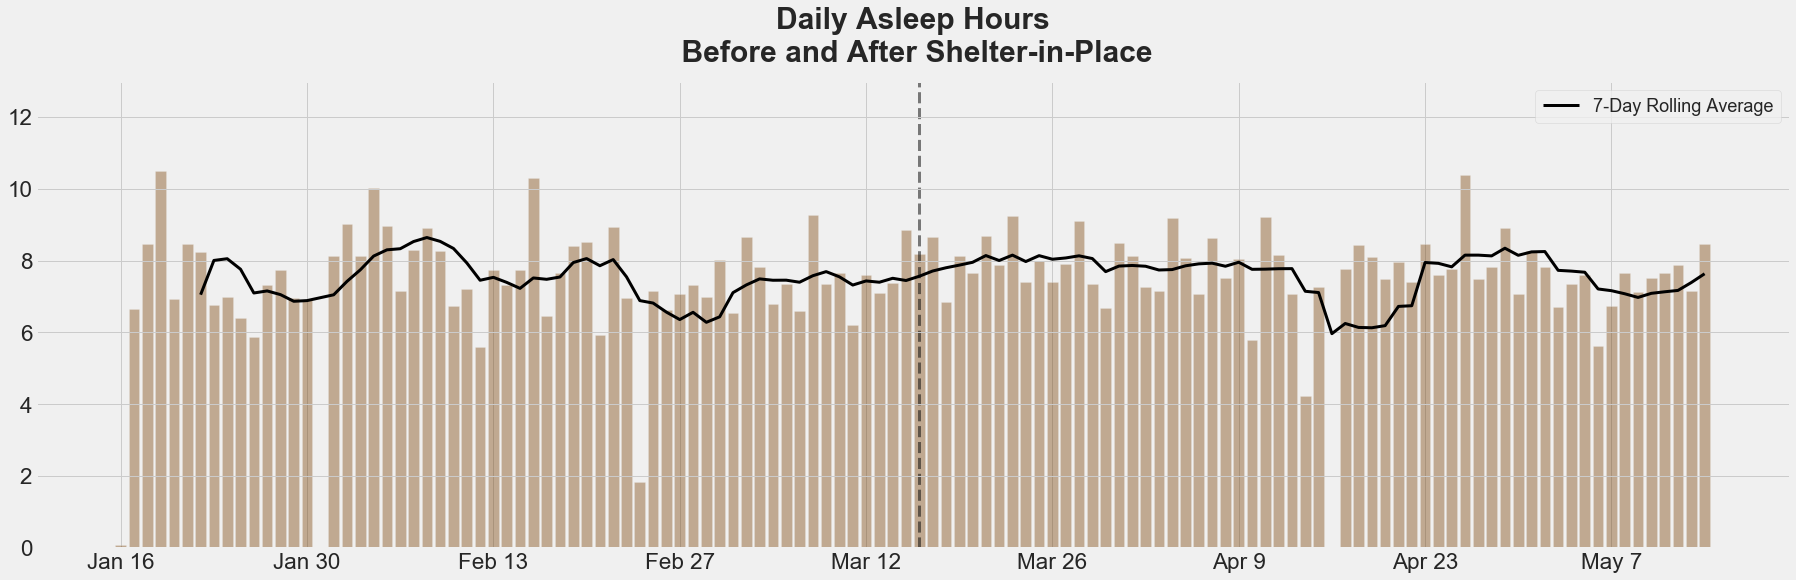
There is no statistical difference in the average amount of sleep I get now versus what I used to get.
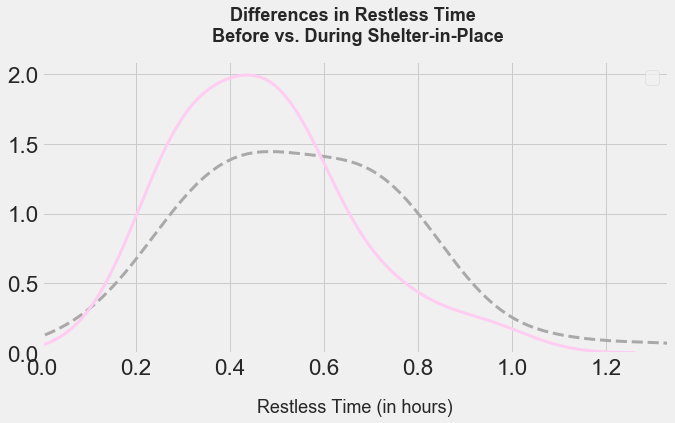
However, it does look like I actually have slightly reduced my restlessness during sleep, which is very surprising because I would have thought otherwise (significant at the 5% level).
Summary
To nobody’s surprise, life right now is very different than it was before. How different exactly - in some respects very and in others not much at all.
- Dinners and board game evenings with friends have turned into zoom hangouts and sessions on Tabletopia.
- Instead of trips over the weekend, we stay in and work.
- An occasional body pump class at the local 24 hour fitness is now substituted by an occasional Youtube fitness workout.
- Snowboarding was cut short and swimming pools are not an option so I am trying cycling now.
- Insomnia caused by inconsistent bedtimes and anxiety is replaced with insomnia caused by inconsistent bedtimes and other types of anxiety.
- Visits to friends apartments replaced with walks around our neighborhood and perhaps a balcony conversation with the friends nearby.
- Date nights out are now date nights in (watching Westworld or playing a round of Brass Birmingham or 7 Wonders Duel).
- Rather than eating out, we cook most of our meals (at least we did initially).
- In-person woodworking classes replaced with online courses.
- Tri-weekly 3-hour commutes reduced to 5-second commutes.
- Visits to see family substituted with more frequent phone calls and an occasional visit in the backyard, 6 feet apart with masks.
Despite all the changes, I feel extremely fortunate that my family is healthy (knock on wood that they stay that way) and that I am able to work remotely.

Why write all this?
Well I got more time on my hands now…
I am trying out new hobbies. I used to journal when I was a kid and I enjoy tracking behavior so I thought I’d combine the two.
Hopefully, if you made it this far (or skipped to the bottom which is what I would have done), that you enjoyed some parts and maybe even found them relatable, perhaps you even discovered a couple of youtube channels or comedians or learned about a new statistical test. :)
Leave a Comment